We're the LiteFolio team. Wanting to build a stock portfolio spreadsheet but not sure what columns you need or how to calculate average cost basis? We hear this a lot. The short answer: split your spreadsheet into a transaction log and a holdings summary, keep the columns to a minimum, and you can absolutely build your own investment tracker. This article walks through sheet layout, formulas, and what to do when a DIY spreadsheet stops being sustainable.
If you'd rather cut down on manual upkeep, try the manual-entry tracker LiteFolio
See LiteFolio →Start by splitting your spreadsheet into two sheets
The first decision to make when building a stock portfolio spreadsheet is to split it into a "transaction log" sheet and a "holdings summary" sheet. The reason is simple: cram buys, sells, and current holdings onto one sheet, and your summary formulas get fragile every time you add a row.
For example, say you buy Stock A in three separate purchases and sell it once. If you log that history chronologically on a single sheet, answering "how much do I currently hold" means manually scanning for the relevant rows and adding and subtracting by eye every time. That falls apart fast as your number of tickers grows.
Instead, give the transaction log sheet the job of appending "what happened, when" chronologically, and let the holdings summary sheet calculate "what things look like right now" with formulas. This two-sheet split is the basic structure for tracking investments in a spreadsheet.
The columns your transaction log needs
Your transaction log needs six columns: date, ticker, transaction type, quantity, price, and fee. These six are enough to calculate both average cost basis and gain/loss after the fact. Adding more than this just means more typing and makes the habit harder to keep up.
Here's a concrete example of what the columns might look like.
You can enter transaction type as the text "Buy" or "Sell," or represent it as a sign on the quantity — +1 for buys, -1 for sells. The second approach keeps the rollup formulas described below simpler, so if you're just getting started, we'd recommend using column D for "direction" and signing the quantity in column E.
Dividends, deposits/withdrawals, and stock splits can either be mixed into the same transaction log with an added "transaction type" column, or kept on a separate sheet. A type column is fine while volume is low, but as covered below, summing dividends alone gets messy once things scale up.
If you use multiple brokerage accounts, add an "account" column
If you hold the same stock across multiple brokerage accounts, adding an "account" column to your transaction log lets you tally both by account and overall later. Split accounts into separate sheets instead of adding a column, and you'll be flipping between sheets every time you want to see your whole portfolio.
See how to track investments across multiple brokerage accounts →Formulas for average cost basis and gain/loss in your holdings summary
The holdings summary sheet exists to automatically display each ticker's current quantity, average cost basis, and unrealized gain/loss. Get this right, and adding one row to your transaction log is all it takes to update your entire summary. Let's start with the basic formulas.
The basic average cost basis formula
Average cost basis is calculated as "total amount spent buying ÷ total shares bought." When you've bought in three separate purchases, the underlying idea is this weighted average.
As a spreadsheet formula, this becomes each ticker's total cost divided by its total quantity. When you need to filter and total by ticker, combining this with SUMIF() is the standard approach.
The thing to watch for here is not accidentally including sell transactions in the division. A sale only reduces your quantity — it doesn't change your average cost basis (for a partial sale). You need to either split your SUMIF ranges by transaction type, or always include a "type = Buy" condition in the SUMIF itself.
We cover more detailed calculation patterns — including how partial sales work and what happens when multiple purchases are mixed together — in our average cost basis calculation guide.
The basic realized gain formula
Realized gain on a sale is calculated as "sale proceeds − (average cost basis × shares sold) − fee." Set up a formula on the sell row that references the average cost basis at that point in time, and your gain calculates itself every time you sell.
Keep dividend records as their own "ticker, date, amount, tax" set
Dividend records work best as their own separate set of columns: ticker, payment date, amount received, and tax withheld, at minimum. The reason is that dividends have a different formula structure from buys and sells, and mixing them into the same rollup logic tends to break your average cost basis formulas.
Whether you use a dedicated dividend sheet or a distinct block of rows within your transaction log, having the following columns makes annual dividend totals easy to pull:
You can total annual dividends received by applying SUMIFS() to this dividend sheet with a year condition. If you want to go deeper on how to think about tracking and managing dividends, see our dividend tracker app guide.
Four limits every DIY spreadsheet eventually hits
The design above is plenty functional for tracking your investments, but the longer you use it, the more you'll run into four recurring limits: entering data from your phone, checking things on the go, broken formulas, and handling dividends or splits. These aren't signs you built it wrong — they're limitations baked into how spreadsheets work.
In practice: typing numbers into a spreadsheet on your phone while looking at your brokerage app is fiddly and easy to misalign. Checking your holdings on the go takes more taps than you'd like, even with a cloud-based spreadsheet app. Inserting rows or selecting the wrong range can silently shift your SUMIF ranges, throwing off your totals. And when a stock split happens, you have to manually adjust the quantity and price on every past transaction row for that ticker.
None of these limits show up because you lost the motivation to keep tracking — they show up regardless. There's also the risk of not noticing a broken formula and continuing to look at stale numbers, and the more precision you want, the higher the maintenance cost of a spreadsheet climbs.
If you'd rather step away from formula upkeep and just focus on recording, take a look at LiteFolio
Learn more about LiteFolio →What comes after a spreadsheet: a manual-entry app
Once you hit a spreadsheet's limits, you have two options: switch to an account-linking app that pulls data automatically, or move to a manual-entry app that keeps the same "I enter it myself" control as your spreadsheet, while automating just the tallying. The first option is easier, but it's not a great fit if you're uneasy about linking accounts or you want to organize multiple accounts and account types your own way.
With a manual-entry app, the same record columns you built in your spreadsheet — date, ticker, transaction type, quantity, price, fee — carry over directly. The difference is you no longer need to build your own formulas for average cost basis or realized gains; they update automatically the moment you enter a transaction. We cover this idea in more depth in our guide to portfolio trackers without account linking.
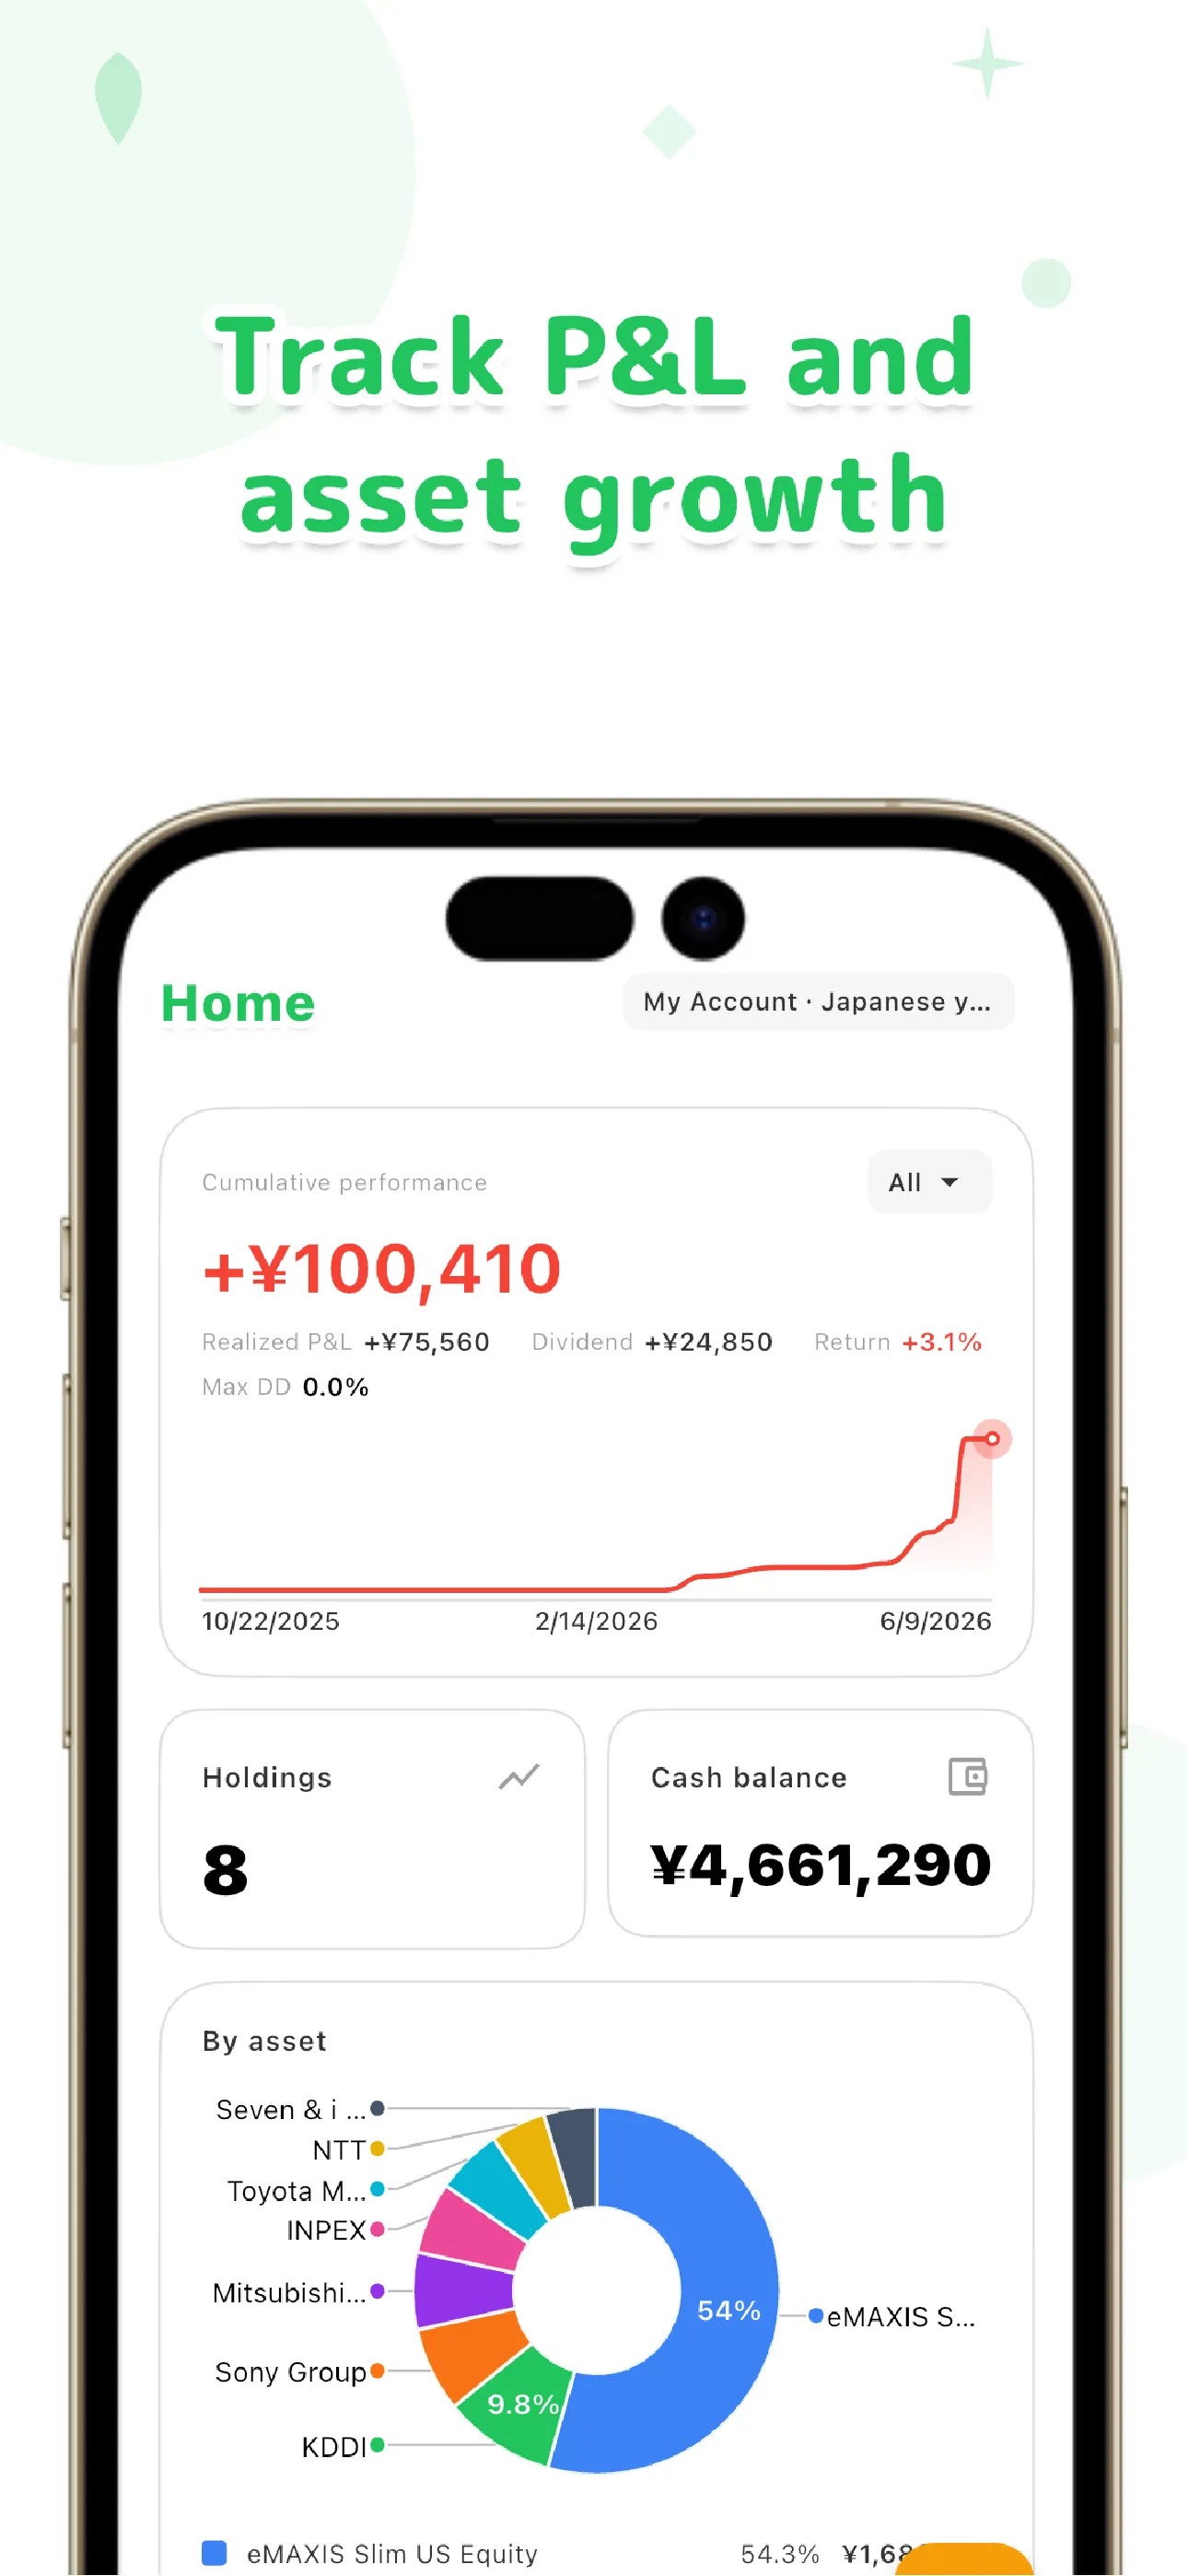
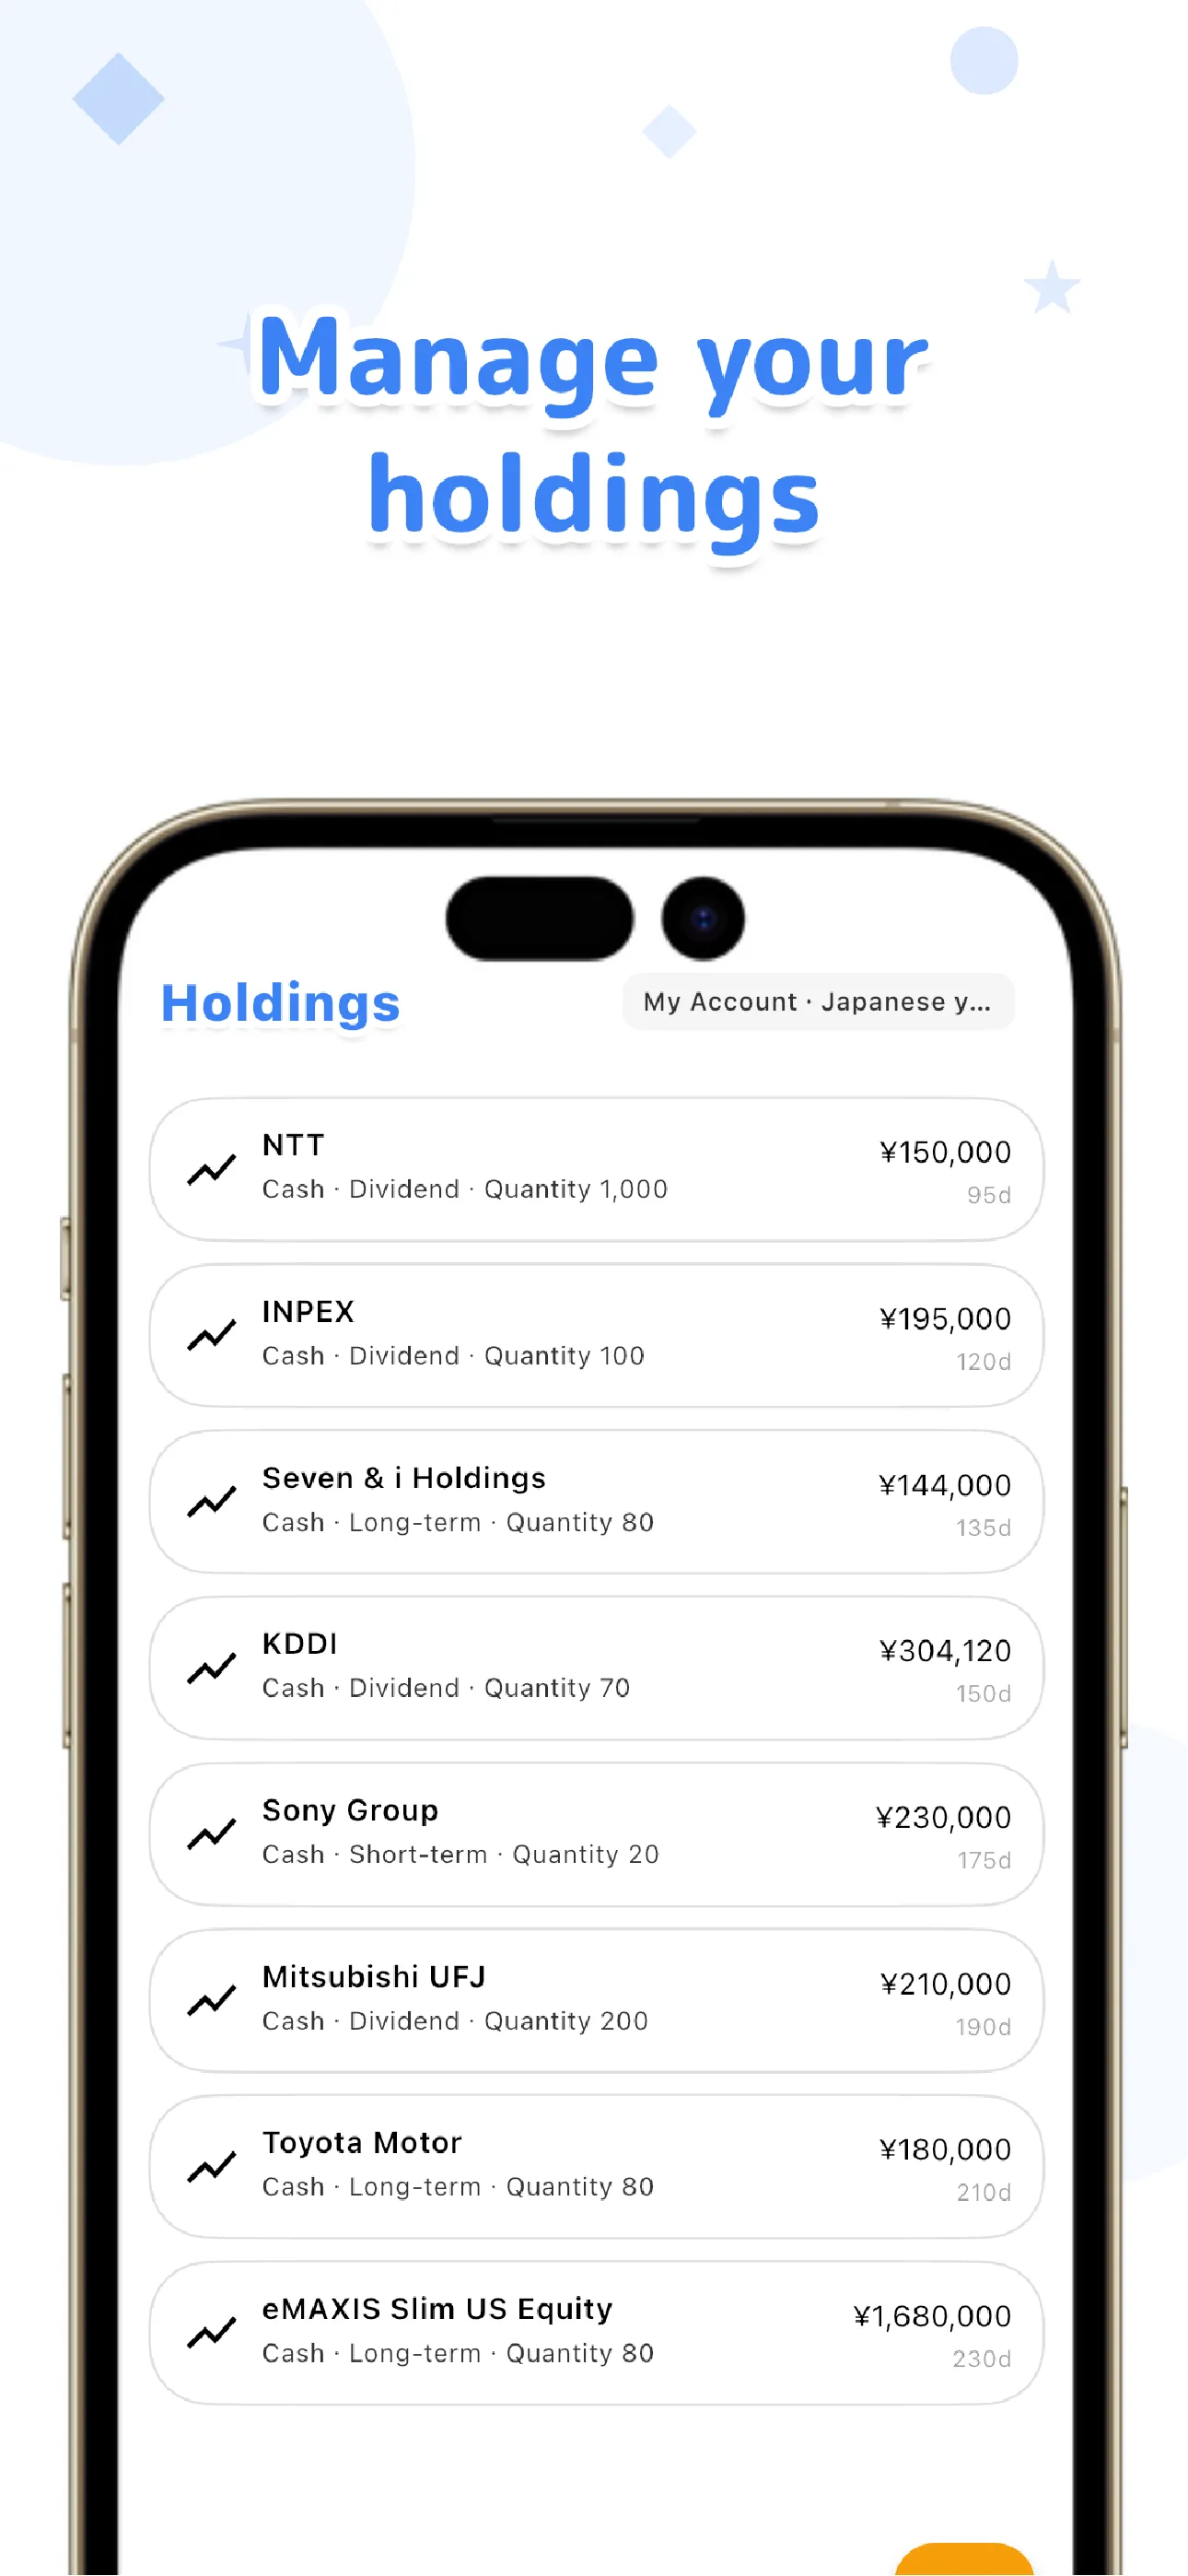
The basic formula for tracking investments in a spreadsheet is splitting your transaction log from your holdings summary, and building it around six columns plus a weighted-average formula. Building it yourself first is a great way to figure out exactly which fields actually matter to you. Once entry effort or formula maintenance starts to feel like a burden, moving to a manual-entry app that automates only the tallying — without changing what you record — is a smooth next step.

LiteFolio
An investment tracker that never connects to your brokerage account — log buys, sells, dividends, deposits, fees, and stock splits by hand. It keeps the same "enter it yourself" freedom as a spreadsheet while automating rollups like average cost basis, realized gains, and asset allocation. Data is stored local-first on your device. Available now on iOS and Android.
Learn more about LiteFolioLiteFolio is a record-keeping and visualization tool and does not provide investment advice.
Frequently asked questions
Should I use Excel or Google Sheets to track my portfolio?
The sheet design and formula logic are the same either way. If you often check or add entries from your phone while out and about, Google Sheets is a better fit; if you're mostly working from a computer and want to get fancy with formulas, Excel works well. Both share the same limits around formula upkeep and awkward mobile entry.
How do I fix my spreadsheet after a stock split?
Multiply the quantity on every past transaction row for that ticker by the split ratio, and divide the price by the same ratio. The more rows you have, the heavier this manual adjustment gets, so if you hold stocks that split frequently, this becomes a major share of your ongoing maintenance cost.
Can I track multiple brokerage accounts together in one spreadsheet?
Yes. Add an "account" column to your transaction log, and include account as a condition in your holdings summary formulas, and you can see both the per-account and overall totals from the same sheet. See our guide to tracking investments across multiple brokerage accounts for details.
Is LiteFolio free to use?
LiteFolio is available now for iOS and Android. Check the App Store or Google Play for current features and pricing. Some features, like cloud sync, are planned as part of a paid Pro plan, but the pricing for core recording features hasn't been finalized. Check the LiteFolio page for the latest updates.