We're the LiteFolio team. Dollar-cost averaging into a mutual fund or ETF adds to your share count automatically each month, so you can technically keep it going without tracking anything at all. But once you start tracking it, you can see your share count build up and watch your average cost per share move over time — turning "I've kept this up" and "how much I've been able to contribute" into numbers you can actually see. In this article, the LiteFolio team explains why tracking a DCA plan is worth doing, with a concrete example.
Log every contribution and watch your share count and average cost build up
See LiteFolioDCA is meant to be automatic — but tracking it is still worth it
Once you set up a recurring buy into a mutual fund or ETF, it executes automatically every month. There's no need to check the market daily or decide the timing for each purchase — "set it and forget it" is exactly the point of dollar-cost averaging. None of that changes with tracking.
But "set it and forget it" and "no need to keep a record" are two different things. Because the contributions happen automatically in the background, how much you've actually invested and how many shares you've accumulated won't register as a real, felt sense unless you track it. A sense that it's working, an understanding of your own contribution pace, and visibility into how your average cost is changing are three things that only become visible once you start tracking.
What tracking your DCA plan reveals
Log each contribution one at a time, and the scattered, individual monthly purchases turn into a connected trend. That's because once entries stack up, "how it's growing" and "how it's changing" emerge as numbers that a single purchase could never show you on its own. Specifically, tracking reveals items like these:
Once you can see your share count building, you get a number-based confirmation that your DCA plan is on track. Once you know your total contributed, you can look back on the "contribution power" you've put in so far. And tracked together with net worth growth over time, you can compare your growing share count side by side with the change in your position's value. Next, let's look at exactly how average cost moves with each contribution, using real numbers.
How does average cost move with a monthly DCA plan? A worked example
Mutual funds and ETFs are typically quoted at a price per share. If you invest the same dollar amount every month, a cheaper month buys you more shares and a pricier month buys you fewer. Let's work through a fund where you invest $300 a month for three months.
Add up these three contributions and you've invested $900 in total, holding about 61.667 shares. Average cost per share is calculated as "total contributed ÷ total shares held," so here's how your average cost moves at the end of each month:
Because the price was a cheap $12.00 in month two, your average cost dropped to $13.33. In month three, the price climbed back to $18.00, but average cost only recovered to $14.59 — still below the simple average of the three prices, $15.00. This is simply an arithmetic result of how DCA works: buying the same dollar amount each month naturally buys more shares when the price is low and fewer shares when the price is high. This isn't a claim that one price pattern is better than another for investment purposes — the point here is that this dynamic only becomes visible once you actually track it. We go into the average cost calculation itself in more depth in our average cost basis calculation guide.
Comparing ways to track your DCA plan
Broadly, there are three ways to track a DCA plan: a notebook, a spreadsheet, and an app. In short, any of them work fine if you're only dollar-cost averaging into one fund, but the more funds you're contributing to, the more you should favor a method that takes over tallying shares and recalculating average cost for you.
Notebook
Writing down each month's contribution amount and share price. It requires no setup and you can start right away, but you'll need to work out cumulative shares and average cost yourself with a calculator every time. The more contributions pile up, the heavier that calculation step becomes as a barrier to keeping it going.
Spreadsheet
With the right formulas, automatically calculating cumulative shares and average cost is possible. But every fund you add means adding or fixing formulas, and quickly logging a contribution from your phone isn't very convenient. We cover exactly where spreadsheet-based portfolio management hits its limits in our stock portfolio spreadsheet template guide.
Investment tracker apps
The advantage of an app is that share count, average cost, and total contributed all recalculate and update automatically the moment you log a contribution. There's no "enter it, then tally it yourself" step like with a notebook or spreadsheet — you can focus purely on the monthly recording. The next section shows exactly how this works in LiteFolio.
Log your monthly contributions in LiteFolio
LiteFolio is a manual-entry investment portfolio tracker that never connects to any brokerage account — you log your buys, sells, dividends, deposits and withdrawals, fees, stock splits, taxes, and notes yourself. Worth flagging upfront: there's no automatic DCA import or brokerage sync — you enter each month's contribution yourself. Entering the dollar amount, share count, and price takes just a single entry, once a month, and only a few seconds.
Logged contributions build up automatically into each holding's share count, average cost, and total cost. Here's what it looks like.
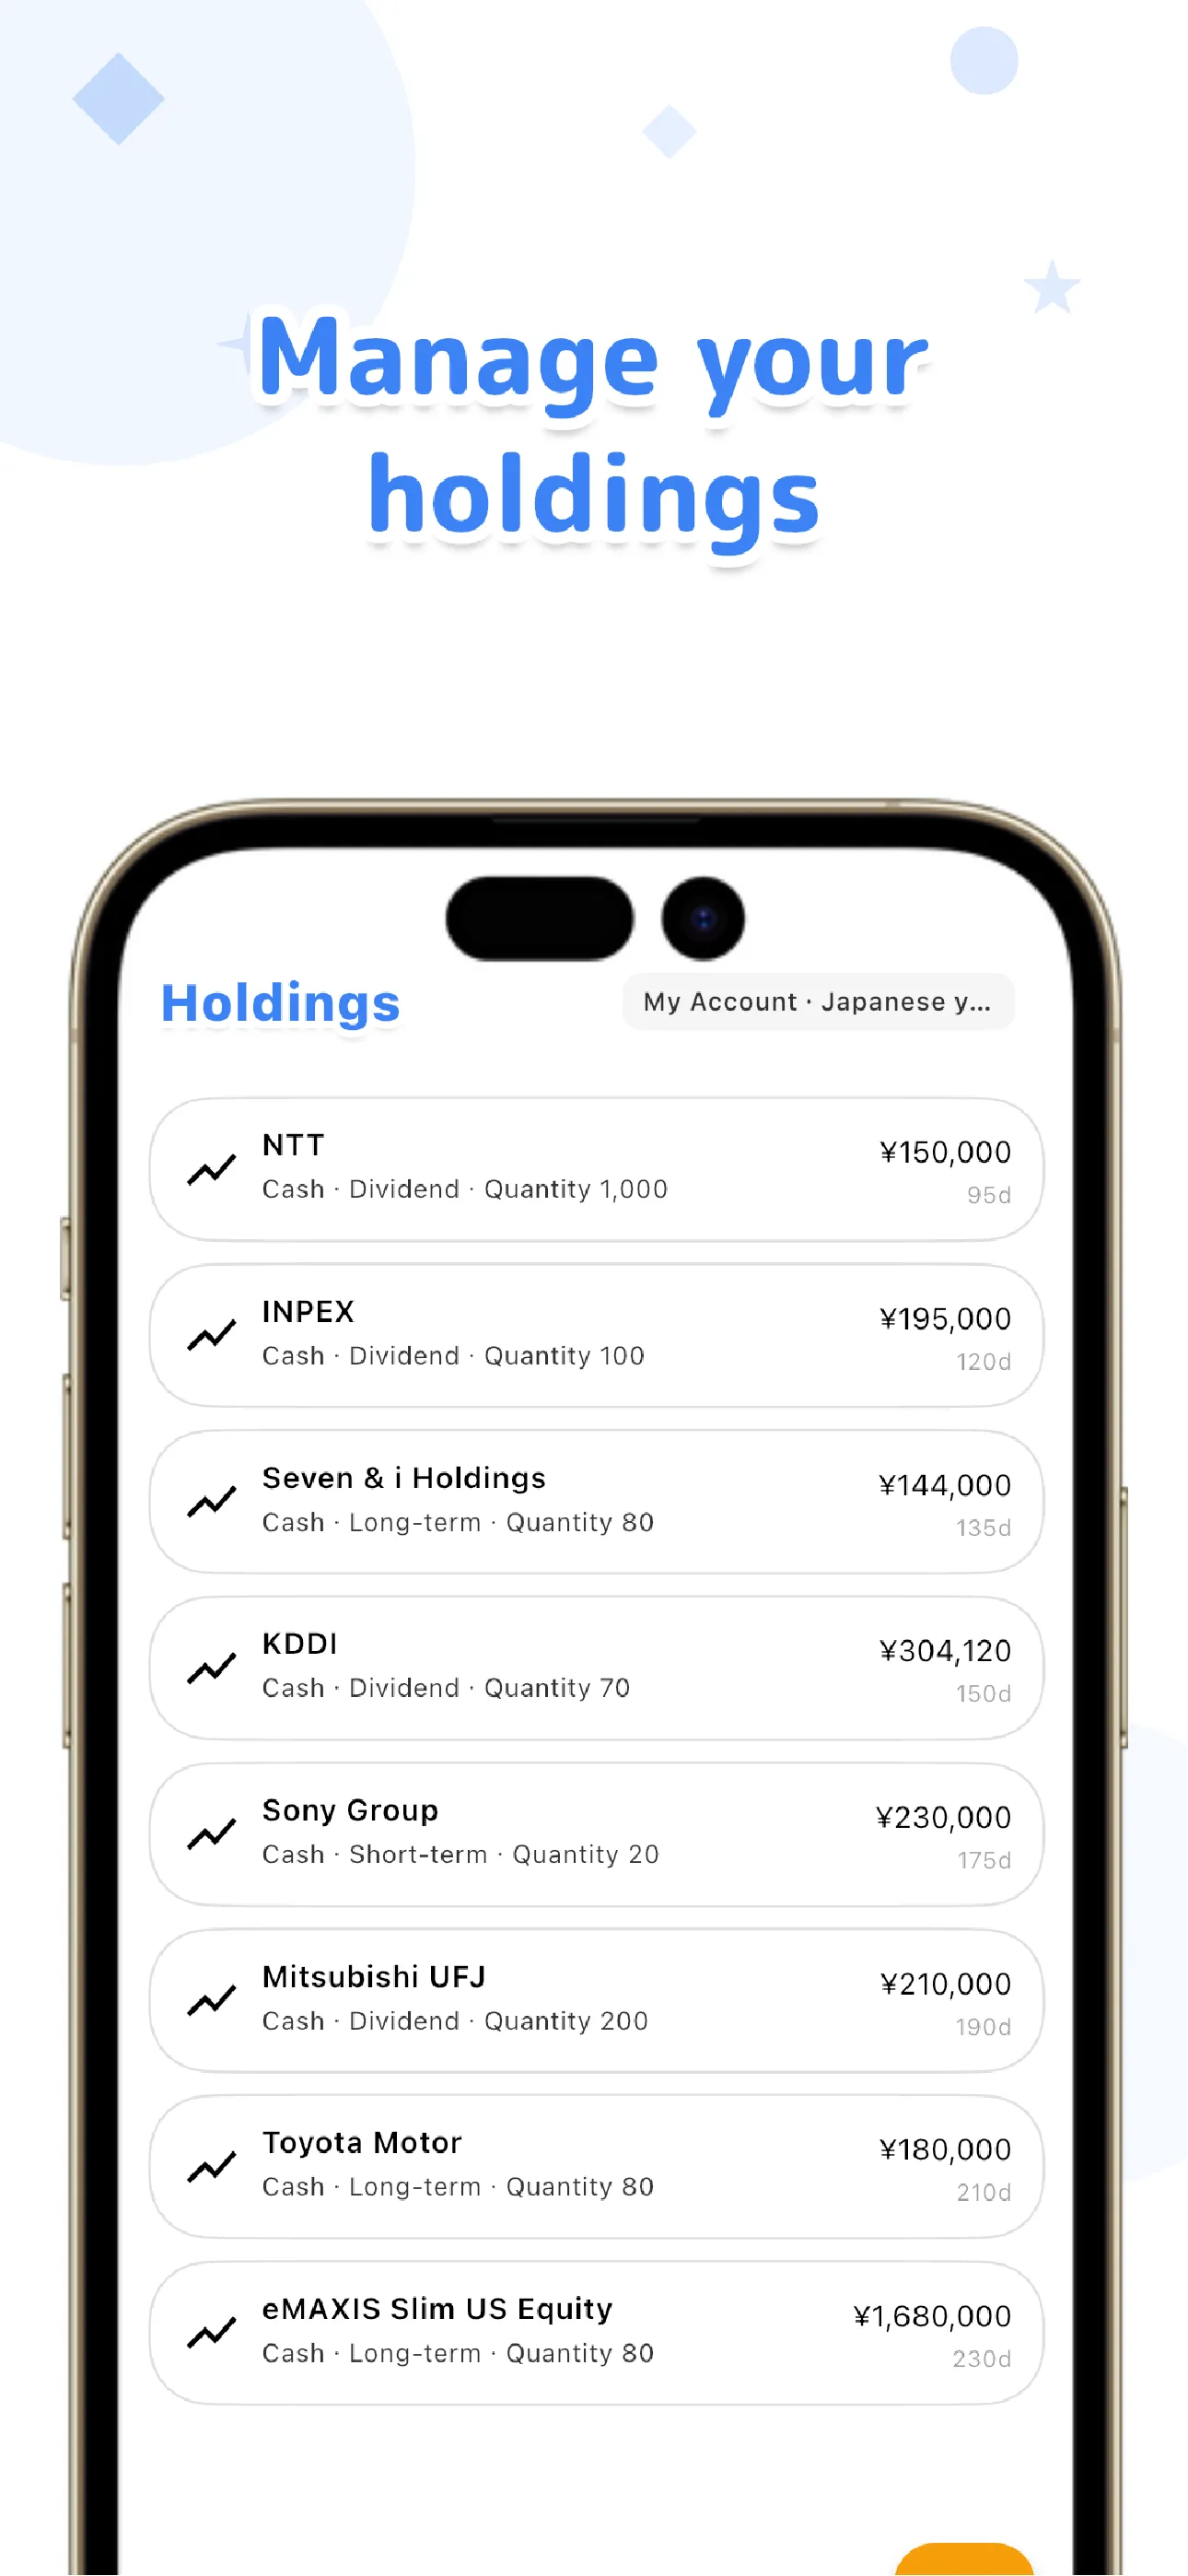
Track your share count, average cost, and total contributed all in one place
Learn more about LiteFolioAsset allocation can be viewed by ticker, sector, or custom list, and alongside realized gains, portfolio value over time, and a transaction timeline, your DCA contributions are shown as one piece of your whole portfolio. Everything you log is local-first, saved on your device first, and if you want to sync across multiple devices, the Pro plan's cloud sync handles that.
Share count and average cost from a DCA plan aren't numbers memory can keep up with. Log each month's contribution one at a time, and the sense that it's working, along with the changing numbers, naturally comes into view. LiteFolio is a record-keeping and visualization tool and does not provide investment advice.
LiteFolio
A manual-entry investment portfolio tracker that never connects to your brokerage account. Log buys, sells, dividends, and deposits, and see share count, average cost, asset allocation, and more, visualized automatically. Data is stored local-first. Available now on iOS and Android.
Learn more about LiteFolioFrequently asked questions
Is LiteFolio free to use?
LiteFolio is available now for iOS and Android. Check the App Store or Google Play for current features and pricing.
Can it connect to my brokerage account and log DCA contributions automatically?
No. LiteFolio never connects to any brokerage account, and it has no automatic DCA import or sync feature. You enter each month's contribution (amount, share count, price, etc.) yourself, one at a time.
Can I track ETFs and individual stock DCA plans too, not just mutual funds?
Yes. LiteFolio isn't limited to mutual funds — you can log and visualize buys, sells, dividends, and deposits/withdrawals for stocks, ETFs, and any other asset you can manually enter.
Will it work on both iOS and Android?
Yes. LiteFolio is available now on both iOS and Android.