We're the OneTapLog team. With a habit, what you often want to see isn't a single day's checkmark but the shape of the whole run — where it held together and where it broke. A list of entries tells you something, but it doesn't show continuity at a glance. In this article we'll talk about why a line is the right picture for a habit, and how the Gantt view draws it for you.
A habit is easier to read as a line than as a list
Whether you kept a habit going is fundamentally about continuity: did the days connect, or did a gap open up? A vertical list of notes makes you count and infer, but a horizontal bar shows it instantly — solid where you kept going, broken where you didn't. We came to think that seeing the streak as a line is what makes a slip impossible to ignore.
And a slip you notice is one you can recover from. The danger isn't missing a day; it's not realizing the habit has quietly stopped. A picture that shows the gap turns that drift into something you can act on.
Tag each occurrence in one tap
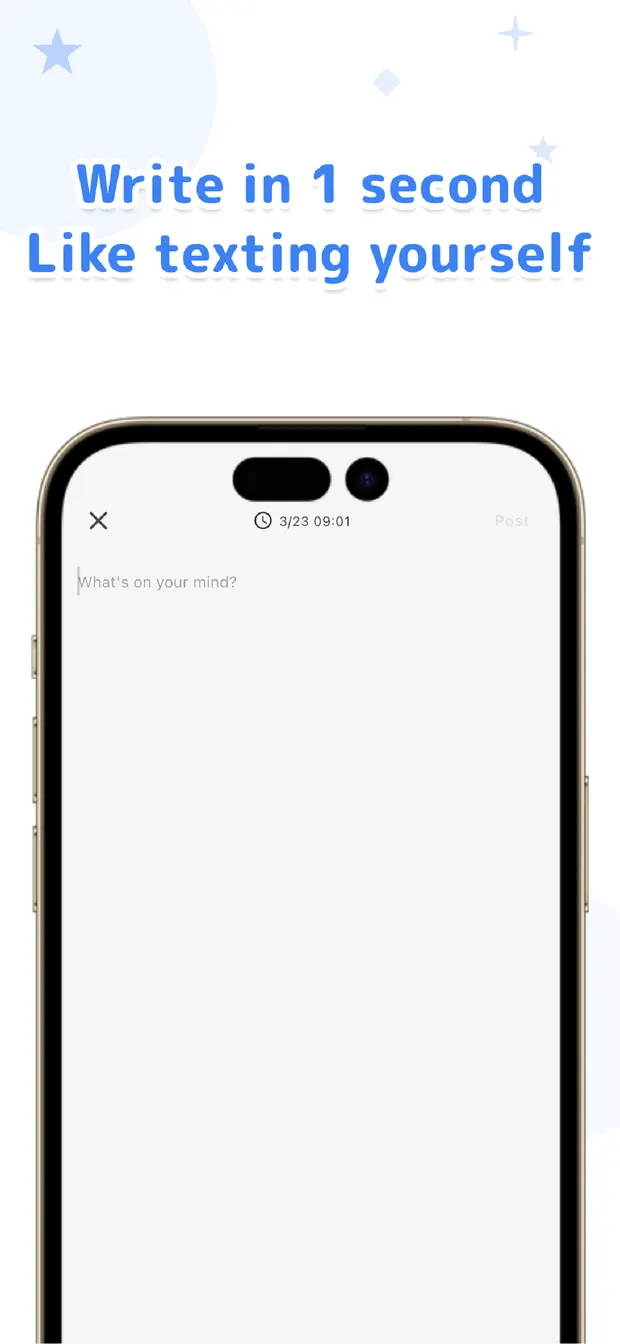
The groundwork is the same lightweight logging as always. When you launch OneTapLog the input field is already open, so you type something like Studied 30 min #study and send in one tap. Give each habit its own tag and keep marking it whenever you do it.
You don't have to think about charts while you log — you just leave the note. The tag is what later lets the habit be drawn as a bar, so all the effort that matters happens in that one quick tap.
The Gantt view shows streaks and gaps at a glance
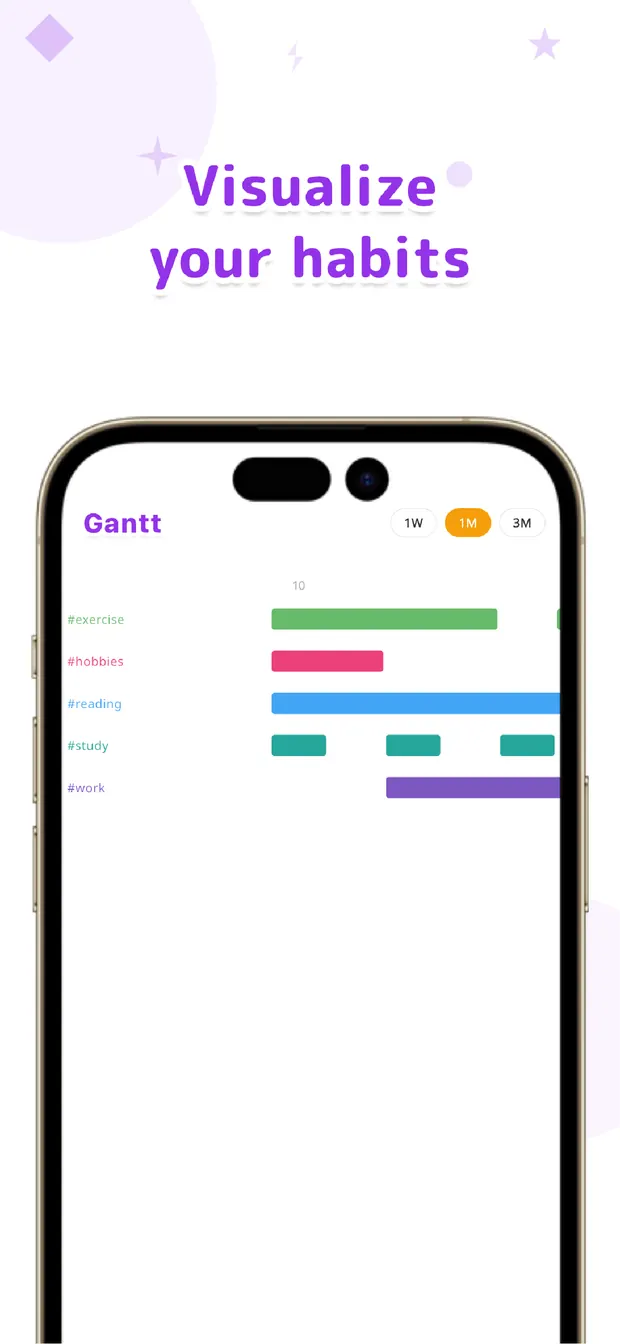
Open the Gantt view and each tag becomes its own row of bars across the days. A habit you've kept up reads as a long, connected band; one that lapsed shows a clear break. Side by side, you can compare several habits and see which are thriving and which are slipping, all in one look.
When a gap appears, that's the moment to restart before it becomes the new normal. There's no prediction or scoring here — just the honest shape of what you've actually done, laid out so you can read it and respond.
If checkmark-style trackers have never quite shown you the bigger picture, seeing your habits as lines might change that. Tag it lightly, read it as a streak — that, we believe, is what helps you catch a lapse and get back on track.
OneTapLog
One line with a #tag, one tap. See each habit as a streak bar in the Gantt view, spot gaps, and recover. No account, free to start.
Learn more about OneTapLogFrequently asked questions
How does the Gantt view help with habits?
It draws each tagged habit as a horizontal bar across the days, so a streak shows as a connected band and a lapse shows as a break. That makes continuity readable at a glance, rather than something you infer from a list.
What do I need to do to make the bars appear?
Just log a one-line note with a tag whenever you do the habit, like #study. The Gantt view uses those tagged entries to build the rows, so there's nothing extra to set up beyond your usual quick logging.
Does it predict or score my habits?
No. There's no prediction, scoring, or analysis. The Gantt view simply shows the honest shape of what you've recorded, so noticing a gap and deciding to restart is left to you.
Can I compare several habits together?
Yes. Each tag becomes its own row, so multiple habits sit side by side. You can see at a glance which ones are holding up and which have started to slip.