Apps that "visualize" habits have multiplied. But most use calendar stamps or rows of dots. An app that shows your habit streaks with a Gantt chart is, in fact, almost unheard of. We're the team behind OneTapLog, and we deliberately brought the Gantt chart into reviewing your records.
This article covers what a Gantt chart is, why it works so well for visualizing habits and records, and how OneTapLog grows a Gantt chart just from writing. Note: what we're talking about is not project management at work, but a Gantt chart for reviewing habits and daily records.
What is a Gantt chart, anyway?
A Gantt chart is originally a diagram used in project management. Time (dates) runs along the horizontal axis and items down the vertical, and each item's duration is shown as a horizontal bar. At a glance, you see "what ran, when, and for how long."
That property — showing continuity as bars along a time axis — turns out to pair beautifully with habit records. Keeping it confined to work task management, we thought, would be a waste.
Why a Gantt chart works for habits
The usual way to visualize habits is calendar stamps or dots. Those show the points of "did it / didn't do it" on a given day. A Gantt chart is different: it shows continuity as a bar (a line).
With bars, the flow — "kept it up for three weeks," "broke off for two weeks here" — is intuitive. The length of a streak and the location of a gap are clearer than points. People want to fill a gap when they see one, and that psychology turns into motivation to continue. That's the strength of a Gantt chart.
But Gantt-chart record apps are rare
Yet very few habit or journaling apps use a Gantt chart. Most habit apps are dot-style or graph-style, and the Gantt charts in project-management tools are too heavy and awkward for "recording habits." An app that combines casual recording with Gantt-chart review is hard to find.
OneTapLog shows #tag streaks as a Gantt chart
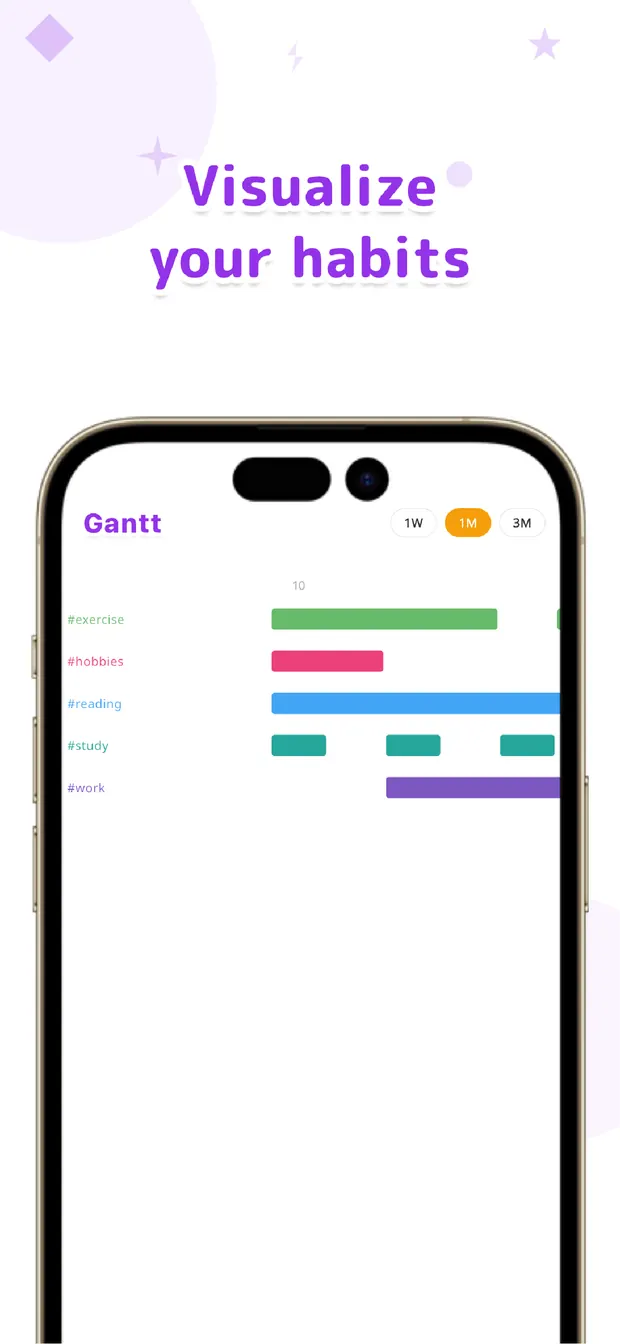
OneTapLog is one of those rare "Gantt-chart record apps." Write a tag like #workout #reading #earlyrise in your text, and that tag's streak appears as a bar on the Gantt chart.
You can switch between 1-week, 1-month, and 3-month views, so you can take in both short bursts and long-term trends. Line up several tags and the balance of your life — "workouts are going, but reading has stalled" — is obvious at a glance.
Just write, and the Gantt chart grows
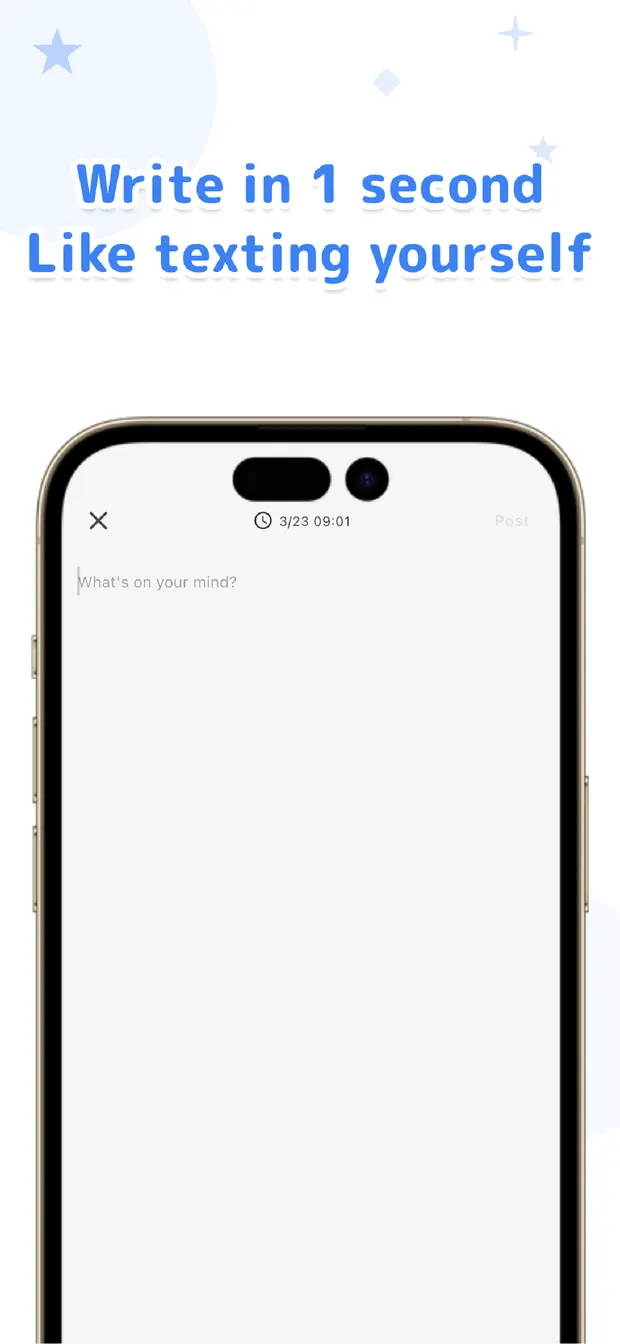
"A Gantt chart" might sound like a lot of input. But in OneTapLog, the chart needs no special operation. The moment you open the app, the keyboard is up and you just send a line with a tag. That automatically becomes a bar on the Gantt chart.
In other words, recording with the feel of writing a diary or a memo grows a review chart on its own. "Recording" and "visualizing" aren't separate, so there's almost no extra effort to keep it up.
Summary: see continuity as a line
Stamps and dots that show points are useful, but a Gantt chart — which shows continuity as a line — is better for grasping the flow and gaps of a habit intuitively. And few apps deliver that through casual recording. With OneTapLog, you just write a line with a tag. Start growing a Gantt chart where your streaks show up as bars, today.
OneTapLog
Write one line with a tag and your streaks become a Gantt chart. 1-second writing, no account, free to start.
Learn more about OneTapLogFrequently asked questions
Is there an app that manages habits with a Gantt chart?
There are few, but yes. Write a tag in your text in OneTapLog and that tag's streak appears as a bar on a Gantt chart. Most habit apps are dot- or calendar-style, so Gantt-chart viewing is a rare feature.
How is a Gantt chart different from a calendar?
Calendars and dots show "did it that day" as points. A Gantt chart shows continuity as a bar (a line), so the length of a streak and the spot where it broke are intuitive. It's better when you want to grasp the flow.
Is this a project-management app?
No. OneTapLog's Gantt chart is for reviewing habits and daily records, not work scheduling. Just record a casual line and your continuity shows up as bars.
Does using the Gantt chart need special input?
No. Just write a tag in your text and send a line, and it automatically becomes a bar on the Gantt chart. The review chart grows with the feel of writing a diary or memo.